
Most Profitable CS2 Skins: What a Decade of Price Data Actually Shows


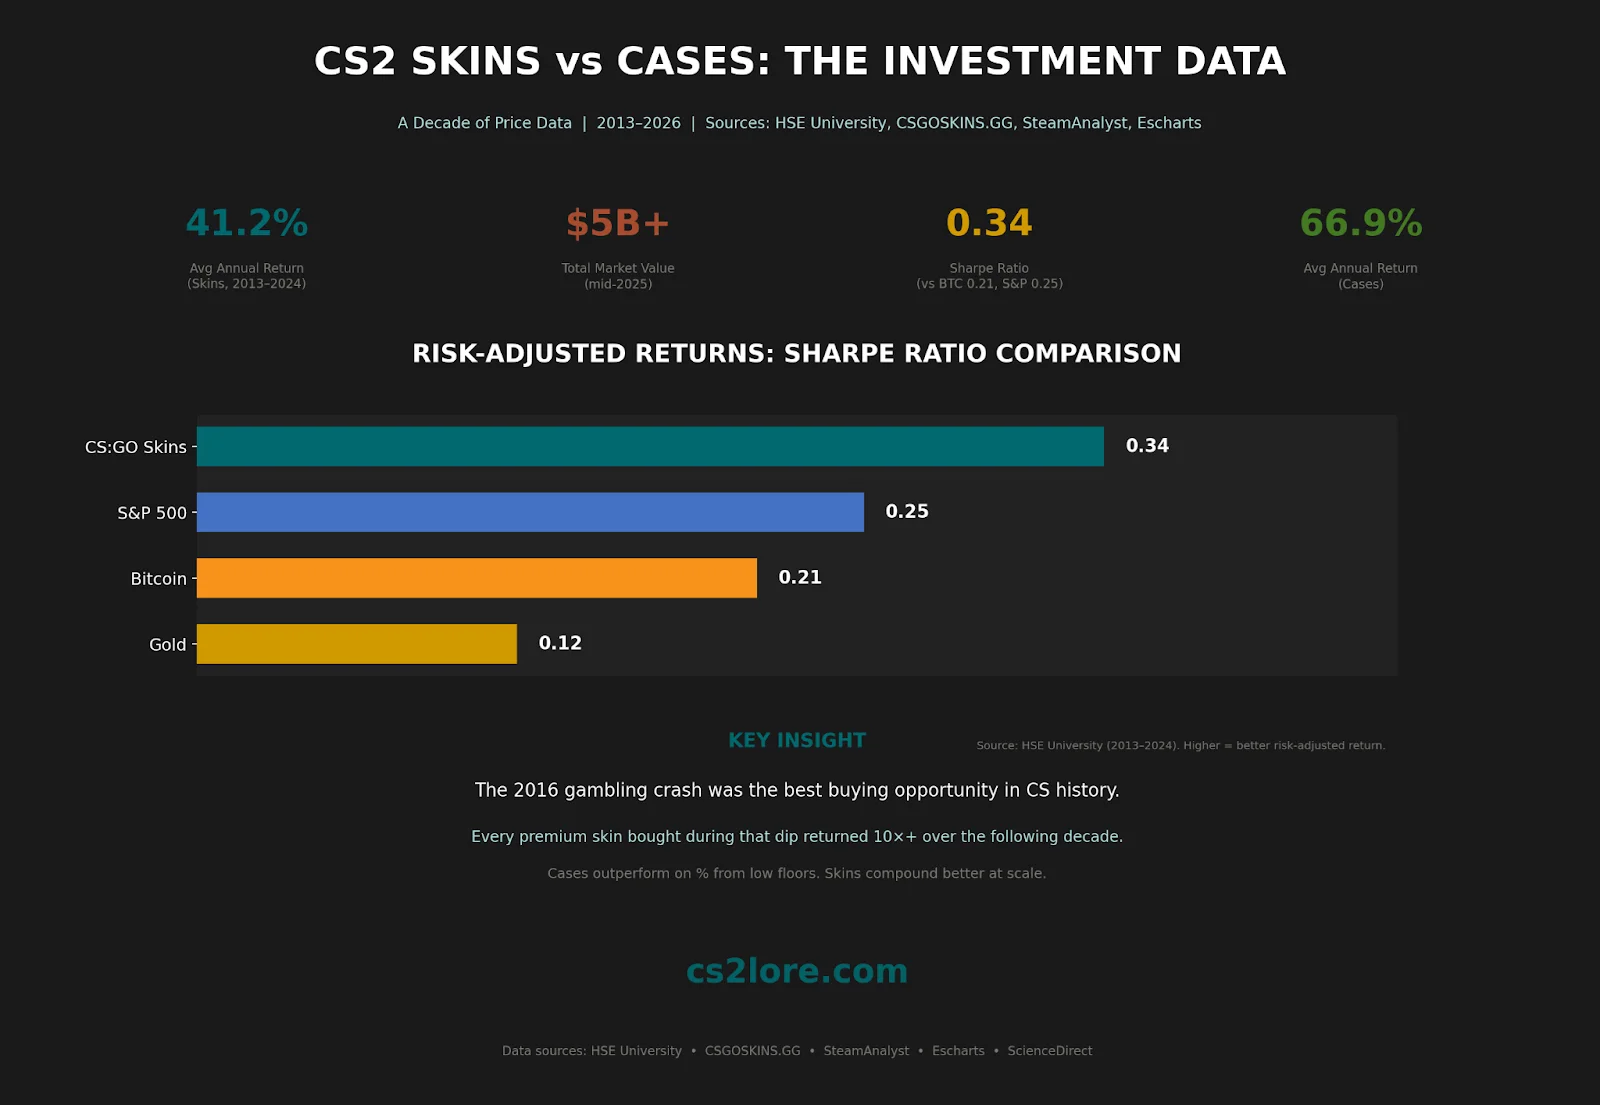
The CS2 skin market surpassed $4.3 billion in total value as of March 2025, and by mid-2025 was approaching $5 billion. A peer-reviewed study by HSE University found CS:GO skins delivered an average annual return of 41.2% between 2013 and 2024 — outperforming stocks, bonds, and gold, matching Bitcoin with a significantly better Sharpe ratio (0.34 vs Bitcoin's 0.21). Below is a structured look at the most profitable CS2 skins by timeframe, how cases compare, and what separates the two as investments.
Top Performers by Timeframe
Skin | 1-Year | 3-Year | 5-Year | 10-Year |
|---|---|---|---|---|
AK-47 Fire Serpent | +27% | ~+180% | ~470–600% | ~1,400–1,800% |
AWP Dragon Lore (FN) | +3–5% | ~+42% | ~+220% | ~967–1,500% |
M4A4 Howl (FN) | +3% | ~+15% | ~+360% | ~900–1,300% |
Glock-18 Fade | ~+15% | ~+80% | ~+300–400% | ~+800% |
Desert Eagle Blaze | ~+12% | ~+60% | ~+300% | ~+700% |
Sources: CSGOSKINS.GG, SteamAnalyst. ROI calculated from practical entry points, not all-time lows.
The AK-47 Fire Serpent leads across every timeframe. Its 27% one-year gain is notable in a market where many premium skins moved in single digits. From 2016 entry (~$150–200), it has returned roughly 1,400–1,800% — powered by Operation Bravo scarcity and iconic status.
The M4A4 Howl — the only Contraband-rarity skin in CS2 — shows muted YoY gains (+3%) but hit $9,210 mid-year. Its closed supply creates a structural price floor. The AWP Dragon Lore surged to $14,000+ during CS2's 2023 announcement, settling around $12,800. The 2016 gambling crash was retrospectively the best buying window in CS history — every premium skin bought then returned 10×+ over the decade.
How Cases Compare
Case | Entry Price | Current Price | Total Return |
|---|---|---|---|
Bravo Case | $0.03–0.10 (2015) | $80–100+ | >80,000% |
Breakout Case | $0.03 (2016) | $15–20 | >50,000% |
Operation Phoenix | $0.03 (2015) | $8–12 | >25,000% |
Glove Case | $0.10–0.20 (2017) | $12–18 | >6,000% |
Cases are the highest-returning CS2 assets on a percentage basis from near-zero entry.
A ScienceDirect study found cases averaged 66.9% annual return — the highest in any systematic study. The HSE research adds a nuance: cheap items (~$2.25) generated nearly 19% monthly returns, while expensive skins (~$1,700) returned under 3% monthly — still beating stocks. Cases live at the low-price-point sweet spot. Buff163, handling 60–70% of CS2 supply, sets global floor prices 30–40% below Western platforms like CSFloat.
Skins vs. Cases: Different Beasts Entirely
Dimension | Skins | Cases |
|---|---|---|
Liquidity | Medium — $5K+ items take days/week | High — sells in hours |
Volatility | High — event-driven (tournaments, streamers) | Low — slow-grind appreciation |
Supply | Semi-unique (float, wear, pattern, stickers) | Fungible (identical units) |
Price Drivers | Aesthetics + prestige + streaming visibility | Scarcity + nostalgia + contained loot value |
Behavioral Analog | Fine art, vintage cars (unique provenance) | Vintage wine, rare stamps (commodity) |
Arbitrage | 40–42% gap: Buff163 vs CSFloat | Minimal cross-platform gap |
A butterfly knife CS2 at 0.001 float can cost 200–400% more than the same knife at 0.35 float. A Dragon Lore with a centered scope pattern is worth multiples of a standard one. This uniqueness is why skins behave like collectible art rather than commodities. The 40–42% Buff163-to-CSFloat price gap on high-tier items is a documented arbitrage opportunity that doesn't exist for cases.
Bottom Line
The skin Sharpe ratio (0.34) beats the S&P 500 (0.25), gold (0.12), and Bitcoin (0.21). Cases = lower risk, higher percentage returns from cheap entry, commodity-like liquidity. Skins = higher ceiling, knowledge-intensive, unique provenance, collectible dynamics. The CS2 market remains mostly populated by gamers, not institutional investors — that information asymmetry is intact, but not permanent.
This article is for informational and educational purposes only and does not constitute financial advice. Past performance is not indicative of future results.